Image analysis for cancer-related quantitative analysis and radiation oncology treatment applications belong to one of the core areas of IIBI expertise. We have established and validated software for tumor segmentation from PET, CT, MR, PET/CT, PET/MR, and MVCBCT, We have also developed methods for tumor treatment outcome prediction, optimality-guaranteeing algorithms for intensity-modulated radiotherapy, and developed a barrage of cancer-related bioinformatics support approaches.
Oncology image analysis at IIBI:
Beichel team

Reinhard R. Beichel
Professor, Electrical and Computer Engineering
- Projects
- Quantitative cancer image analysis (PET, CT, ...)
- Radiomics
- Treatment outcome assessment and prediction
- Quantitative PET phantom analysis methods for quality control and scanner harmonization
- Algorithm comparison and publicly available tools (see qin.iibi.uiowa.edu) for quantitative PET-CT analysis
-
Publications
Wu Team

Xiaodong Wu
Professor, Radiation Oncology
-
Projects
- Wu Lab
- Algorithm Design, Analysis and Implementation
- Geometric Optimization
- Computer-aided Medical Surgery and Diagnosis
- Biomedical Image Analysis
- Data Mining
- Bioinformatics
-
Publications
Sonka Team

Milan Sonka
IIBI Co-Director
-
Projects
- As part of the NIH U10 EY017281 project, we focus on general aproaches to organ and tumor segmentation
- Examples include:
- Liver and liver tumors
- Brain tumors
- Head and neck tumor
-
Publications
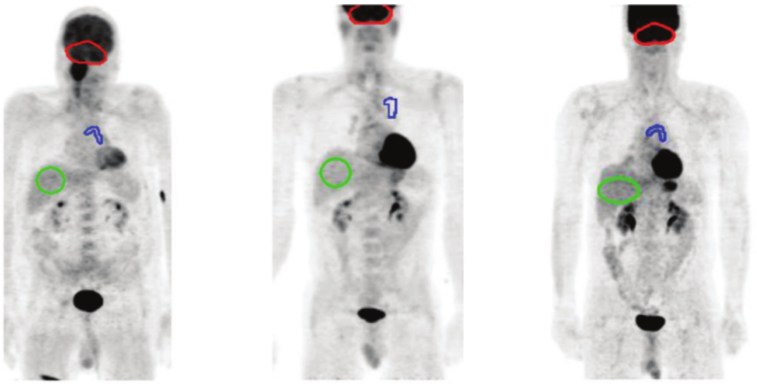
Quantitative PET-CT image analysis for treatment outcome prediction: Examples of automatically identified reference regions in cerebellum, aortic arch, and liver for FDG PET uptake normalization. All PET scans are depicted as inverted maximum intensity projections.

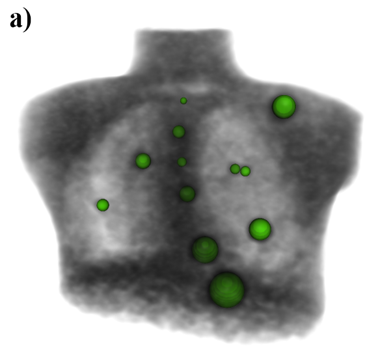
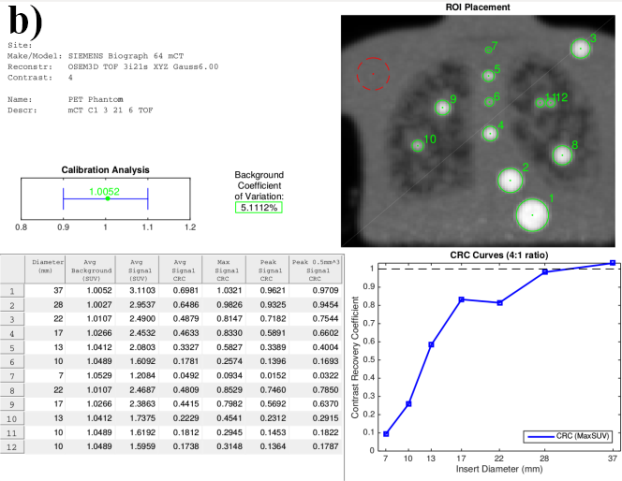
Automated PET phantom analysis: Results of an automated analysis of a PET Torso phantom. (a) Volume rendering of automatically identified inserts, and (b) corresponding quantitative analysis report.
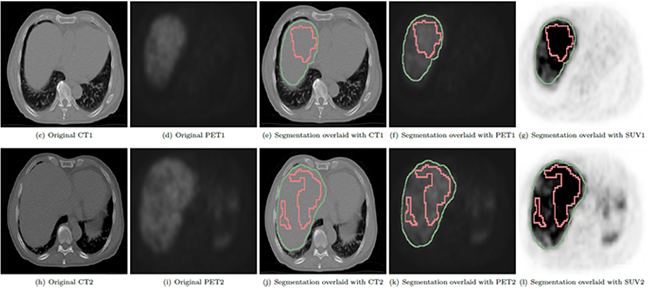
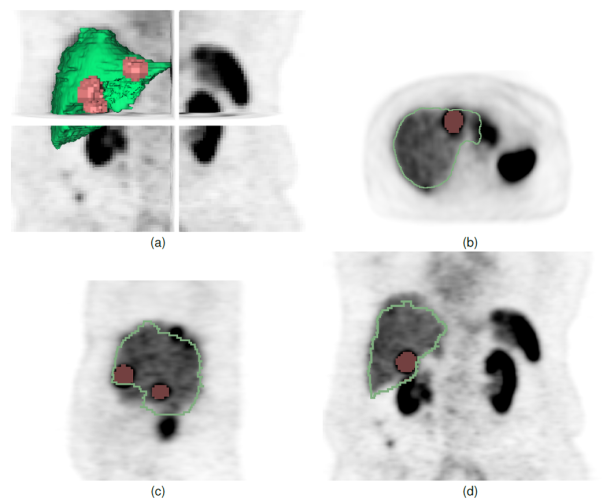
Liver and liver tumor segmentation in PET DOTATOC images. Left to right: Original CT, original PET, liver/tumor segmentation overlaid on CT, liver/tumor segmentation overlaid on PET, liver/tumor segmentation overlaid on PET after PET image enhancement for visibility - two slices of a 3D volume shown; Separate panel: 3D liver/tumor segmentation.
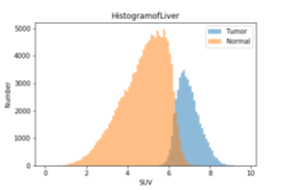
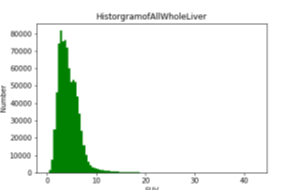
Quantitative analysis of liver tumor load in patient above. Left to right: Global histogram of PET SUV in the liver (PET DOTATOC images); SUV histogram of normal liver and liver tumor tissue. Normal liver SUV: 4:77±1.11, tumor SUV: 6:97±0:56. Tumor-to-liver volume ratio: 25:6%.

Quantitative analysis of liver tumor load in a small patient cohort, PET DOTATOC images. Left to right: Global histogram of PET SUV in the cohort; SUV histogram of normal liver and liver tumor tissue. Normal liver SUV: 3.78±1.35, tumor SUV: 8.47±3.54. Average tumor-to-liver volume ratio: 15.5%.

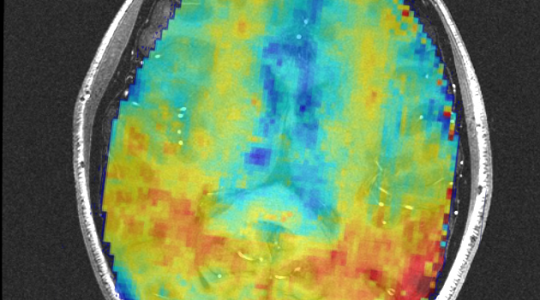
LOGISMOS+JEI based brain tumor segmentation and quantitative volumetric analysis in 3D.
The purpose of these videos is to demonstrate the capability of the algorithm, not to show a clinically correct segmentation.